Over the last four months of
blog posts we've looked at 7 different approaches for exiting iron condors. These exits included:
- Exit at 8 DTE
- ML40% - exit when the loss is equivalent to 40% of the margin for the position OR 8 DTE
- BSP - exit when the market is below the strike of the short put (BSP) OR 8 DTE
- 0.6:0.6 - exit if the trade has a loss of 60% of its initial credit OR if the trade has a profit of 60% of its initial credit OR 8 DTE
- 0.6:0.9 - exit if the trade has a loss of 60% of its initial credit OR if the trade has a profit of 90% of its initial credit OR 8 DTE
- 0.7:0.9 - exit if the trade has a loss of 70% of its initial credit OR if the trade has a profit of 90% of its initial credit OR 8 DTE
- 0.8:0.9 - exit if the trade has a loss of 80% of its initial credit OR if the trade has a profit of 90% of its initial credit OR 8 DTE
We applied these exits to iron condors with different delta short strikes (8, 12, 16, and 20 delta) at different days to expiration (38, 52, 66, and 80) on 3 different starting structures of iron condor:
- Standard (STD) - an iron condor with an equal number of put and call credit spreads.
- Delta Neutral (DN) - an iron condor with fewer call credit spreads than put credit spreads in order to create a position delta near 0. This structure performs better in an advancing market.
- Extra Long Put (EL) - a Standard iron condor with one additional long put for every 10 put credit spreads. This structure performs better in a declining market.
So how did each of these variations perform? Let's review the equity curves for all of the combinations listed above, to get a qualitative sense of the performance. Recall that the y-axis scale is the same for all of the equity curves (0% - 1000%), except for the 16 and 20 delta variations of the 66 DTE trade (0% - 1400%).
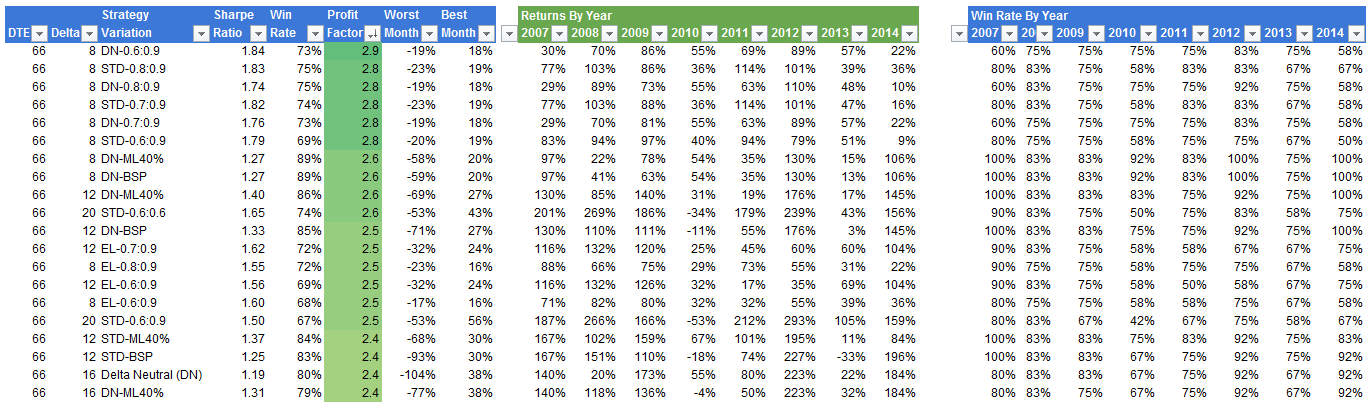
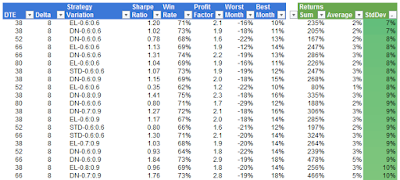
With these equity curve images in our minds, let's look at the trade metrics. The three tables below show the top 20 strategy variations (out of 336) in terms of selected metrics.
 |
| (click to enlarge) |
This first table shows the top 20 Sharpe Ratios, which range from 1.41 to 1.84. Of these top 20, 19 are at 66 DTE, with a strong leaning toward the 8 delta short strike variations. The top five are dominated by the DN and STD variations using loss:profit exits of 0.6:0.9, 0.7:0.9, and 0.8:0.9.
 |
| (click to enlarge) |
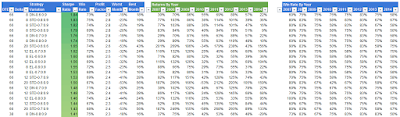
The second table shows the top 20 strategies ordered by highest win rate, ranging from 86% to 89%. The top win rates are heavily dominated by the 8 delta short strike variations...not a surprise. Of these top 20, 11 went to the 66 DTE variations and 8 went to the 80 DTE variations. Again, not a surprise, since at these higher DTE, the short strikes are further from at-the-money. The top performers did not exit using profit or loss based on the credit received. They either used no dynamic exit (exited at 8 DTE), or the BSP or ML40% exits. If you can stomach unrealized losses in your iron condor positions, they seem to turn around and become profitable more often than not.
 |
| (click to enlarge) |
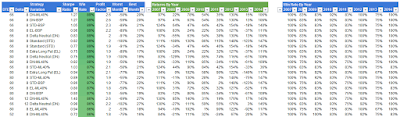
The last of these three tables shows the top 20 strategies ordered by highest profit factor, ranging from 2.4 to 2.9. Recall that the profit factor is just the sum of the profits divided by the sum of the losses. All of the top 20 belong to the 66 DTE variations. Of these top 20, the top 8 are all 8 delta variations (3 STD and 5 DN). The loss:profit exits of 0.6:0.9, 0.8:0.9, and 0.7:0.9 took the top five profit factor positions.
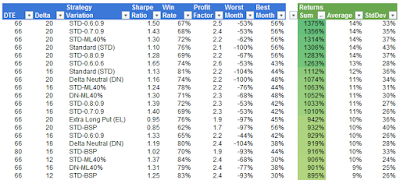
The next two tables show the top 20 strategy variations (out of 336) in terms of monthly return metrics.
 |
| (click to enlarge) |
The top 20 strategies in terms of total returns are the 20 delta and 16 delta variations of the 66 DTE strategies. This is not a surprise, since these strategies were the only ones that required an increase in the y-axis scale for their equity curves. The STD starting structure took the top 7 positions of the top 20. The top 6 positions were the 20 delta variations: STD-0.6:0.9, STD-0.7:0.9, STD-ML40%, STD, STD-0.8:0.0, STD:0.6:0.6.
 |
| (click to enlarge) |
The 20 strategies with the lowest standard deviation of monthly returns are dominated by the 8 delta strategies, with standard deviations ranging from 7% to 10%. These 20 are dominated by the modified starting structures (EL and DN), and taking profits and losses early 0.6:0.6. 9 of the top 20 are starting at 38 DTE.
So, which iron condor strategy is best? That depends on your goal:- Want a high Sharpe Ratio and high profit factor - go with a 66 DTE, 8 delta short strike, using either a DN or STD starting structure. Then use a loss:profit exit of 0.6:0.9, 0.7:0.9 or 0.8:0.9. Historically, this approach produced an average profit per trade of about 5%, with a worst month loss of around 20%.
- Want a high win rate - go with a 66 DTE, 8 delta short strike, using a DN starting structure. Then either let the position go to 8 DTE with no intermediate exit or use the BSP or ML40% exit. Historically, this approach produced an average profit per trade of about 6%, but be prepared for larger drawdowns in the 50% to 90% range.
- Want the highest returns / return per trade - go with the 66 DTE, 20 delta short strike, using the STD starting structure. Then use a loss:profit exit of 0.6:0.9, 0.7:0.9, or 0.8:0.9. Historically, this approach produced an average profit per trade of about 14%, with worst month losses in the 50% to 60% range. With this approach, you would have had a profit factor over 2 and a Sharpe over 1.
- Want a low standard deviation of returns - go with a 38 DTE, 8 delta short strike using either the EL or DN starting structure. Then use a loss:profit exit of 0.6:0.6. Historically, this approach produced an average profit per trade of about 2% or 3%, with a worst month loss in the high teens.
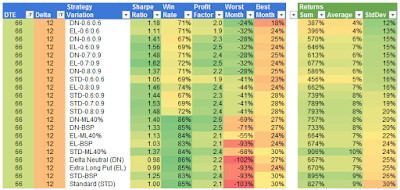
Of all of the 336 strategy variations, my preference is for the 66 DTE, 12 delta short strike, using the STD starting structure. I like the results when this structure is managed with a loss:profit exit of either 0.6:0.9, 0.7:0.9, or 0.8:0.9...see below.
 |
| (click to enlarge) |
All of the data in the tables above can be downloaded in spreadsheet form from Google Docs at:http://dtr-trading.blogspot.com/p/dynamic-exit-iron-condor-statistics.htmlIf you don't want to miss my new blog posts, follow my blog either by email, RSS feed or by Twitter. All options are free, and are available on the top of the right hand navigation column under the headings "Subscribe To RSS Feed", "Follow By Email", and "Twitter". I follow blogs by RSS using Feedly, but any RSS reader will work.