When I posted my
SPX Straddle Backtest Results Summary I didn't plan on writing a follow up article. But after that post I received several emails asking if I could present the SPX straddle results in a slightly different format. Basically tabular results in a structure similar to my iron condor and strangle results articles (
here,
here, and
here) ... with each row associated with a strategy exit variation.
Below, you'll see the same trade metrics that I presented in my
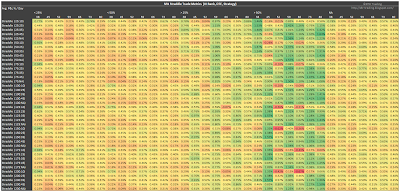
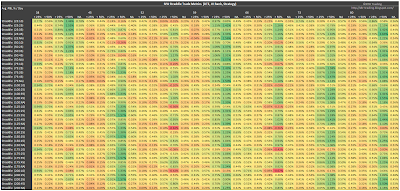
last post, but organized with the strategy variations in rows. For each trade metric category I've included two tables. The
first table in each category has the DTE columns grouped by IVR. For example, the first seven DTE columns are associated with an IVR of < 25%. The
second table in each category switches the groupings between DTE and IVR. For example, the first five IVR columns in the second table are associated with trades initiated at 38 DTE. Since I already discussed these results in my last post, I won't spend a lot of time describing the results below. On to the results...
P&L Per DayAs we noticed in the first article, the largest P&L per day metrics are associated with an IVR > 50%. Recall that only two or three trades per year met this IVR filter criteria...so the green cells are associated with significantly fewer trades than the other cells...this could be a pro or a con depending on how you use this information.
 |
| (click to enlarge) |
 |
| (click to enlarge) |
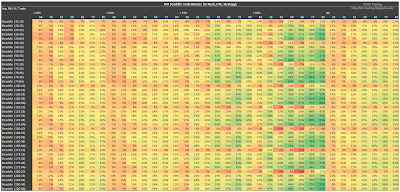
P&L Per TradeSame as above, the trades that met the IVR >50% criteria had the highest P&L per trade numbers. Only about 20 trades out of 100 met the IVR >50% criteria. For the non-IVR filtered category (NA), all 100+ trades were entered.
 |
| (click to enlarge) |
 |
| (click to enlarge) |
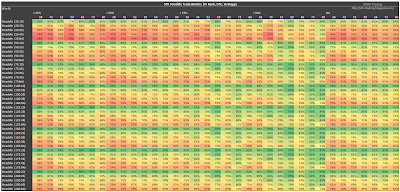
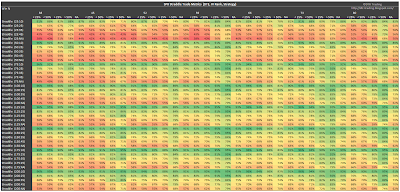
Win RateThe profit taking at 10% of the credit received, stands out in the tables below, although maybe not as clearly as in the win rate table in the last post.
 |
| (click to enlarge) |
 |
| (click to enlarge) |
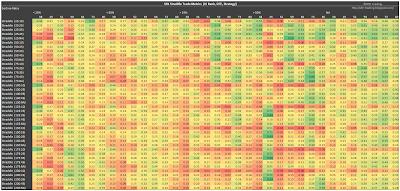
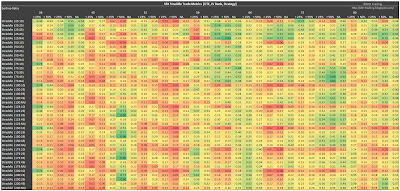
Sortino RatioColumns of strength are apparent in the two tables below. The clustering of strength seems a bit more clear in the Sortino table in the last article.
 |
| (click to enlarge) |
 |
| (click to enlarge) |
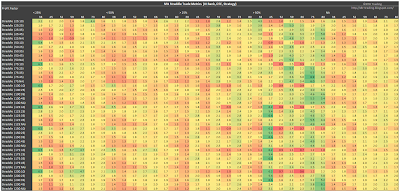
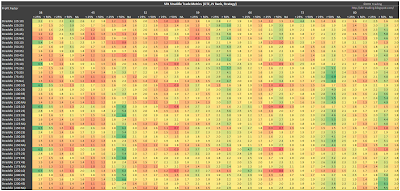
Profit FactorObvious columns of strength again. Typically associated with the IVR >50% filtered trades.
 |
| (click to enlarge) |
 |
| (click to enlarge) |
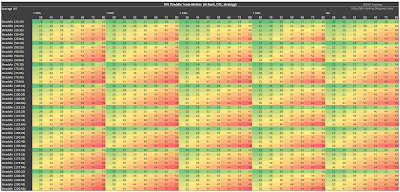
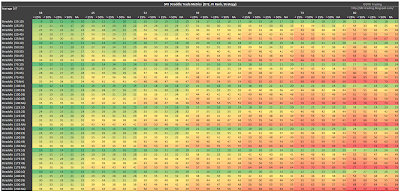
Days In Trade (DIT)The second table highlights the obvious, that the shortest DIT are associated with the trades entered at the lowest DTE. As the profit taking levels are increased, the trade duration is extended. This information can be utilized in many different ways.
 |
| (click to enlarge) |
 |
| (click to enlarge) |
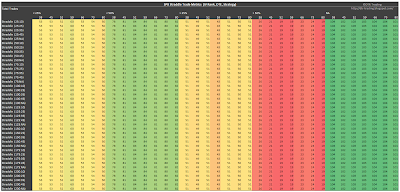
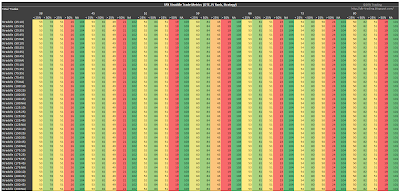
Number Of Trades EnteredYou'll enter the most trades (over 100) if you don't use the IVR filter...the second most trades occurred with the IVR <50% filter. As I mentioned in the last article, one approach for the IVR >50% filter could be as an indicator to increase position size for the 20% of trades that meet this criteria.
 |
| (click to enlarge) |
 |
| (click to enlarge) |
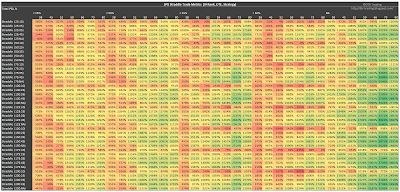
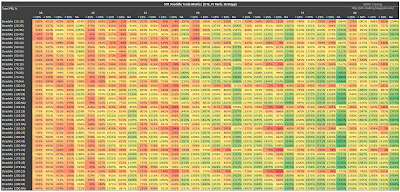
Total P<he greatest total P&L numbers occurred with the non-IVR filtered trade variations.
 |
| (click to enlarge) |
 |
| (click to enlarge) |
If you want to check out the details behind the numbers shown in the tables above, take a look at my
SPX Straddle Summary Page that lists links to all 40+ articles in the series.
Also, today and tomorrow I will tweet (
@DTRTrading) tables that only show the heat map results for the non-IVR filtered trades. These might be interesting to traders that enter trades every month.
Next week, I will start looking at the short straddle on the RUT.
If you like my blog, consider a tax deductible donation via my Movember page...your donation supports men's cancer research: http://mobro.co/dave2015


