This post looks at the results of selling a one-lot straddle on the
S&P 500 Index (SPX), initiated at 52 days-to-expiration (DTE). This is the first post of five on 52 DTE straddles, and will only look at loss exits...the other four posts will explore different profit exits on top of the loss exits in this post. The results displayed in this post represent data from 824 individual trades entered by the automated backtester.
For background on the setup for the automated backtests, as well as the nomenclature used in the charts and tables below, please see the introductory article for this series:
Option Straddle Series - P&L Exits.
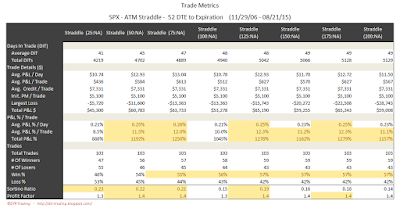
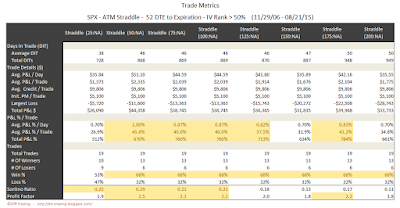
In the trade metrics tables, some of the metrics rows have been highlighted to indicate values that are in the upper half of the readings. One of the metrics to note is the average P&L per day in percentage terms (
P&L % / Trade - Avg. P&L / Day). This is a measure of the P&L per day normalized to the maximum
initial portfolio margin (initial PM) required for that trade run...it tells us the effectiveness of theta with respect to our margin requirement. Also note that the y-axis scale is the same in all of the 52 DTE equity curves.
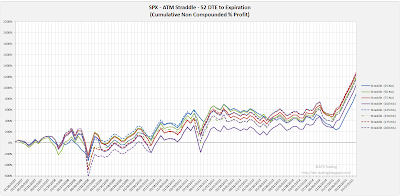
No IV Rank FilterIn this section we will look at the results of entering one trade for every monthly expiration regardless of the implied volatility rank (IVR) of the SPX on the date of entry. Entering these trades at 52 DTE and utilizing our loss exits (described
here) resulted in the equity curves below.
 |
| (click to enlarge) |
The trade metrics for these different exits are shown in the table below. The win rates are pretty lousy. This is due to the lack of profit based exits. These equity curves look very similar to the other non-profit-managed trades at lower DTE. As a reminder, these trades are either exited at expiration OR at the designated loss level.
 |
| (click to enlarge) |
The table below shows the distribution of returns in
five-number summary format. Hat-tip to
tastytrade.
 |
| (click to enlarge) |
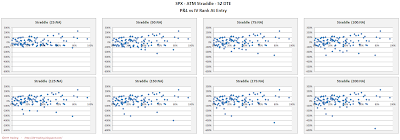
Below are two images of scatter plots for selling 52 DTE ATM SPX straddles. The first image contains one scatter plot per strategy and shows P&L in percentage terms versus IVR for the SPX. The IVR was captured on the day each trade was initiated. Higher IVR yields higher returns.
 |
| (click to enlarge) |
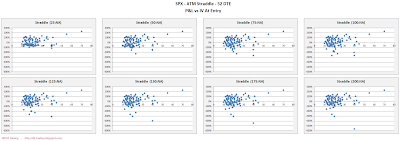
The next image shows P&L in percentage terms versus initial ATM IV. This ATM IV was captured on the day each trade was initiated. Most of the trades are clustered in the 10 to 30 IV region.
 |
| (click to enlarge) |
Neither of the scatter plot images give us any great insight with these straddle variations that only manage losses, not profits.
IV Rank > 50% FilterIn this section we will look at the results of entering one trade for every monthly expiration only when the IVR of the SPX is
greater than 50% ( >50% ). Entering these trades at 52 DTE and utilizing our loss exits (described
here) resulted in the equity curves below. The curves have long periods that are flat...these are times when no trades were taken due to the IVR being below the filter level. This is a familiar pattern that we have seen with all of the trades using the IVR > 50% filter.
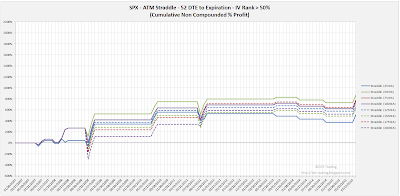 |
| (click to enlarge) |
The trade metrics for these different exits are shown in the table below. These trades have better win rates and significantly better returns per day than the non-IVR filtered trades. Less than 20% of the trades satisfied the IVR filter of > 50%.
 |
| (click to enlarge) |
The table below shows the distribution of returns in
five-number summary format.
 |
| (click to enlarge) |
IV Rank < 50% FilterIn this section we will look at the results of entering one trade for every monthly expiration only when the IVR of the SPX is
less than 50% ( <50% ). Entering these trades at 52 DTE and utilizing our loss exits (described
here) resulted in the equity curves below.
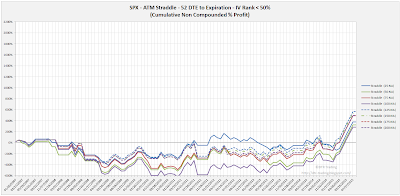 |
| (click to enlarge) |
The trade metrics for these different exits are shown in the table below. These trades have lower win rates and lower total P&L numbers than the non-IVR and IVR > 50% filtered trades shown above.
 |
| (click to enlarge) |
The table below shows the distribution of returns in
five-number summary format.
 |
| (click to enlarge) |
We did not learn too much about how the 52 DTE SPX short straddles perform other than the IV rank filter had a positive impact on trade results. We now have the baseline strategies to compare with the profit taking versions that we will review during the next several days.
In the next post we will look at the automated backtest results of 52 DTE SPX short straddles using the same loss thresholds as above, but with profit taking occurring at 10% of the credit received.
Follow my blog by email, RSS feed or Twitter (@DTRTrading). All options are available on the top of the right hand navigation column under the headings "Subscribe To RSS Feed", "Follow By Email", and "Twitter".


