SPX Strangle - Backtest Results Summary
Over the last six blog posts we looked at the backtest results for over 13,900 options strangles sold on the S&P 500 Index (SPX). Eight different exit approaches were tested on these strangles, including:
We applied these exits to strangles constructed with different delta short strikes (4, 6, and 8 delta) at different days to expiration (45, 52, 59, 66, 73, and 80). For background information associated with the results in this post, please visit the following posts:
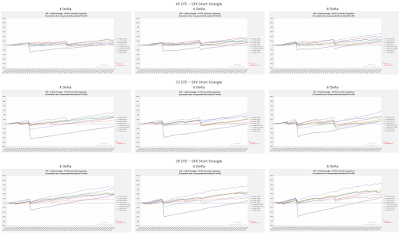
To get a qualitative sense of the performance of these different delta/DTE combinations, we'll first review their equity curves. Recall that the y-axis scale is the same for all of the equity curves (-1000% to 1200%). The thumbnails are small, but larger images will be displayed if you click on them.
Now let's move on to the metrics. Before we do, I should probably describe the table format that I am using to display these results. Each set of metrics is displayed as a pair of heat-map tables. The first table in the pair groups columns by DTE first, followed by short strike delta. The second table in the pair displays the same metrics, but groups columns by short strike delta first, followed by DTE. The first column of each table lists the strategy variation, including the exit used. This column uses the strategy description nomenclature that I used in the last several posts. Hopefully this makes sense, but feel free to submit a comment for this post if you'd like me to clarify the format / nomenclature further.
The first pair of tables shows the average normalized P&L per day by delta, DTE, and strategy. The highest daily returns are concentrated at the 8 delta short strikes at the higher DTE values. This can be seen by the high concentration of green on the right side of the second table of the pair of tables. Additionally, there are clusters of performance for each of the exit approaches...there is almost always a cluster of delta/DTE combinations that work for a particular exit strategy.
The second pair of tables shows the average P&L per trade by delta, DTE, and strategy. Again, the highest overall returns occur in the 8 delta region of the tables. Additionally, the 200:75 and 300:50 have broader out-performance across delta and DTE.
The third pair of tables shows the win percent / win rate by delta, DTE, and strategy. The highest win rates are more highly correlated to exit approach than either delta or DTE. The NA:50 and ExOut NA:50 strategies have the highest win rates...many in the high 90% range. The strangles are similar to the iron condors, in that the greater your tolerance for unrealized losses, the higher your win rate. Another point to note, a common sense point, the more profit you attempt to take out of the trade, the lower your win rate. You can see this when comparing the 200:25, 200:50, and 200:75.
In the fourth pair of tables, we see the Sortino Ratio by delta, DTE, and strategy. Unsurprisingly, the highest Sortino's were associated with the lowest risk:reward exit...the 100:50. There were a couple other clusters of high Sortino's at 59 DTE with the 200:50 and 200:75 exits, and the 73 DTE with the 200:75 and 300:50 exits.
The fifth, and last, pair of tables shows the profit factor by delta, DTE and strategy. Some of the highest profit factors occurred in regions with high Sortino values. For example, the 59 DTE with the 200:50 and 200:75 exits, and the 73 DTE with the 200:75 and 300:50 exits.
Besides the 13,900+ trades used to generate the results above, I backtested an additional 42,000+ SPX strangle strategy variations (with other exits and deltas). In total, I backtested more than 56,000 SPX strangle trades in all. I posted the results from these additional trades on Twitter (@DTRTrading). You can find links to all of these tweets/posts on the SPX Strangle Summary Page.
Looking at the trade metrics for all of the 56,000+ SPX short strangle trades yields more solid patterns. The table below shows the top 20 strategies with the highest normalized average P&L per trade. The 73 and 80 DTE, 16 and 20 delta variations took most of the top spots, with five of the 12 delta variations present as well. The top seven spots were managed at either 300:75 or 200:75. Out of all of the top 20, there were six managed at 300:75, and four managed at 200:75.
The table below lists the top 20 strategies ordered by their win rate. None of the top 20 utilized a loss exit. 15 of the 20 took profits at 25%, with the other 5 taking profits at 50%. Smaller deltas were also a trait of the high win rate trades.
In the next post, we will start looking at the short strangle on the Russell 2000 index (RUT).
As always, feel free to use any of the images/information on my blog...just be sure to reference this blog when sharing the information with others.
Follow my blog by email, RSS feed or Twitter. All options are free, and are available on the top of the right hand navigation column under the headings "Subscribe To RSS Feed", "Follow By Email", and "Twitter". I follow blogs by RSS using Feedly, but any RSS reader will work.
- Strangle (100:50) - exit if the trade has a loss of 100% of its initial credit OR if the trade has a profit of 50% of its initial credit OR at Expiration.
- Strangle (200:50) - exit if the trade has a loss of 200% of its initial credit OR if the trade has a profit of 50% of its initial credit OR at Expiration.
- Strangle (300:50) - exit if the trade has a loss of 300% of its initial credit OR if the trade has a profit of 50% of its initial credit OR at Expiration.
- Strangle (NA:50) - exit if the trade has a profit of 50% of its initial credit OR at Expiration.
- Strangle-ExOut (NA:50) - exit if the moves beyond either short strike OR if the trade has a profit of 50% of its initial credit OR at Expiration.
- Strangle-ExOut (200:50) - exit if the moves beyond either short strike OR if the trade has a loss of 200% of its initial credit OR if the trade has a profit of 50% of its initial credit OR at Expiration.
- Strangle (200:25) - exit if the trade has a loss of 200% of its initial credit OR if the trade has a profit of 25% of its initial credit OR at Expiration.
- Strangle (200:75) - exit if the trade has a loss of 200% of its initial credit OR if the trade has a profit of 75% of its initial credit OR at Expiration.
We applied these exits to strangles constructed with different delta short strikes (4, 6, and 8 delta) at different days to expiration (45, 52, 59, 66, 73, and 80). For background information associated with the results in this post, please visit the following posts:
- Option Strangle Series - Higher Loss Thresholds
- SPX Strangle - High Loss Threshold - 45 DTE
- SPX Strangle - High Loss Threshold - 52 DTE
- SPX Strangle - High Loss Threshold - 59 DTE
- SPX Strangle - High Loss Threshold - 66 DTE
- SPX Strangle - High Loss Threshold - 73 DTE
- SPX Strangle - High Loss Threshold - 80 DTE
To get a qualitative sense of the performance of these different delta/DTE combinations, we'll first review their equity curves. Recall that the y-axis scale is the same for all of the equity curves (-1000% to 1200%). The thumbnails are small, but larger images will be displayed if you click on them.

 |
| (click to enlarge) |
Now let's move on to the metrics. Before we do, I should probably describe the table format that I am using to display these results. Each set of metrics is displayed as a pair of heat-map tables. The first table in the pair groups columns by DTE first, followed by short strike delta. The second table in the pair displays the same metrics, but groups columns by short strike delta first, followed by DTE. The first column of each table lists the strategy variation, including the exit used. This column uses the strategy description nomenclature that I used in the last several posts. Hopefully this makes sense, but feel free to submit a comment for this post if you'd like me to clarify the format / nomenclature further.
The first pair of tables shows the average normalized P&L per day by delta, DTE, and strategy. The highest daily returns are concentrated at the 8 delta short strikes at the higher DTE values. This can be seen by the high concentration of green on the right side of the second table of the pair of tables. Additionally, there are clusters of performance for each of the exit approaches...there is almost always a cluster of delta/DTE combinations that work for a particular exit strategy.
 |
| (click to enlarge) |
The second pair of tables shows the average P&L per trade by delta, DTE, and strategy. Again, the highest overall returns occur in the 8 delta region of the tables. Additionally, the 200:75 and 300:50 have broader out-performance across delta and DTE.
 |
| (click to enlarge) |
The third pair of tables shows the win percent / win rate by delta, DTE, and strategy. The highest win rates are more highly correlated to exit approach than either delta or DTE. The NA:50 and ExOut NA:50 strategies have the highest win rates...many in the high 90% range. The strangles are similar to the iron condors, in that the greater your tolerance for unrealized losses, the higher your win rate. Another point to note, a common sense point, the more profit you attempt to take out of the trade, the lower your win rate. You can see this when comparing the 200:25, 200:50, and 200:75.
 |
| (click to enlarge) |
In the fourth pair of tables, we see the Sortino Ratio by delta, DTE, and strategy. Unsurprisingly, the highest Sortino's were associated with the lowest risk:reward exit...the 100:50. There were a couple other clusters of high Sortino's at 59 DTE with the 200:50 and 200:75 exits, and the 73 DTE with the 200:75 and 300:50 exits.
 |
| (click to enlarge) |
The fifth, and last, pair of tables shows the profit factor by delta, DTE and strategy. Some of the highest profit factors occurred in regions with high Sortino values. For example, the 59 DTE with the 200:50 and 200:75 exits, and the 73 DTE with the 200:75 and 300:50 exits.
 |
| (click to enlarge) |
Besides the 13,900+ trades used to generate the results above, I backtested an additional 42,000+ SPX strangle strategy variations (with other exits and deltas). In total, I backtested more than 56,000 SPX strangle trades in all. I posted the results from these additional trades on Twitter (@DTRTrading). You can find links to all of these tweets/posts on the SPX Strangle Summary Page.
Looking at the trade metrics for all of the 56,000+ SPX short strangle trades yields more solid patterns. The table below shows the top 20 strategies with the highest normalized average P&L per trade. The 73 and 80 DTE, 16 and 20 delta variations took most of the top spots, with five of the 12 delta variations present as well. The top seven spots were managed at either 300:75 or 200:75. Out of all of the top 20, there were six managed at 300:75, and four managed at 200:75.
 |
| (click to enlarge) |
The table below lists the top 20 strategies ordered by their win rate. None of the top 20 utilized a loss exit. 15 of the 20 took profits at 25%, with the other 5 taking profits at 50%. Smaller deltas were also a trait of the high win rate trades.
 |
| (click to enlarge) |
In the next post, we will start looking at the short strangle on the Russell 2000 index (RUT).
As always, feel free to use any of the images/information on my blog...just be sure to reference this blog when sharing the information with others.
Follow my blog by email, RSS feed or Twitter. All options are free, and are available on the top of the right hand navigation column under the headings "Subscribe To RSS Feed", "Follow By Email", and "Twitter". I follow blogs by RSS using Feedly, but any RSS reader will work.