This post looks at a standard (STD) one-lot iron condor on the
Russell 2000 Index (RUT), initiated at 80 days-to-expiration (DTE). The results in this post were derived from approximately 3200 individual trades entered by the backtester.
For background on the setup for the backtests, as well as the nomenclature used in the charts and tables below, please see the introductory article for this series:
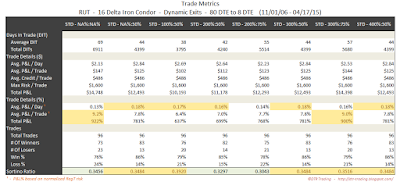
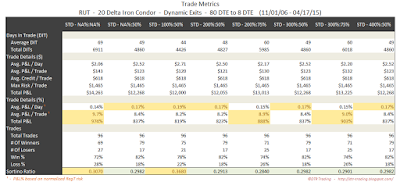
Iron Condor Series - Higher Loss ThresholdsIn the trade metrics tables, I have highlighted some of the rows to indicate values that are in the upper half of the readings. One of the metrics to note is the average P&L per day in percentage terms (
Trade Details (%) - Avg. P&L / Day). This is a measure of the P&L per day normalized to the maximum margin required for that trade run...it tells us the effectiveness of theta with respect to our margin requirement.
8 Delta Short Strikes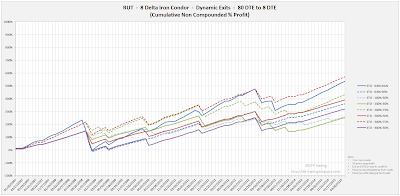 |
| (click to enlarge) |
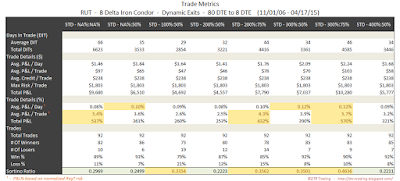 |
| (click to enlarge) |
For the 80 DTE, 8 delta RUT iron condors, the top exit approaches indicated by the metrics were: 200%:75%, 300%:50%, and 300%:75%.
12 Delta Short Strikes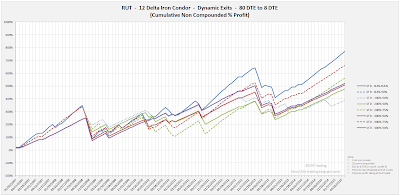 |
| (click to enlarge) |
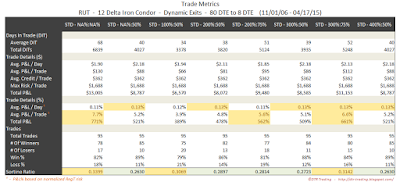 |
| (click to enlarge) |
For the 80 DTE, 12 delta RUT iron condors, there were no clear winners in terms of metrics. The top exit approaches indicated by the metrics appear to be: NA%:NA%, 200%:75%, 300%:50%, and 300%:75%. Note: the NA%:50% and 400%:50% variations have nearly identical equity curves in the chart above.
16 Delta Short Strikes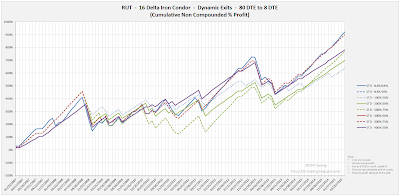 |
| (click to enlarge) |
 |
| (click to enlarge) |
For the 80 DTE, 16 delta RUT iron condors, there were again no clear winners in terms of metrics. The the top exit approach indicated by the metrics appears to be the 300%:75% variation. Note: the NA%:50% and 400%:50% variations have nearly identical equity curves in the chart above.
20 Delta Short Strikes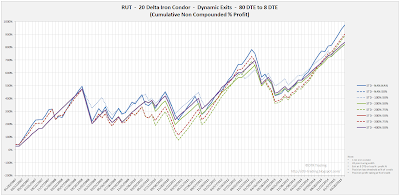 |
| (click to enlarge) |
 |
| (click to enlarge) |
For the 80 DTE, 20 delta RUT iron condors, there were again no clear winners in terms of metrics. Note: the NA%:50% and 400%:50% variations have nearly identical equity curves in the chart above.
With the 80 DTE tests, the highest average P&L per day readings occurred with the 16 delta and 20 delta short strike variations. In the next post I will summarize the results from the last six blog posts.
If you don't want to miss my new blog posts, follow my blog either by email, RSS feed or by Twitter. All options are free, and are available on the top of the right hand navigation column under the headings "Subscribe To RSS Feed", "Follow By Email", and "Twitter". I follow blogs by RSS using Feedly, but any RSS reader will work.


